Candlestick patterns are visual price signals that help crypto traders identify market reversals and momentum shifts. The five most essential patterns for crypto traders are Three White Soldiers, Doji, Engulfing Patterns, Hammer, and the Perfect Dragonfly Doji each offering distinct clues about where price may move next.
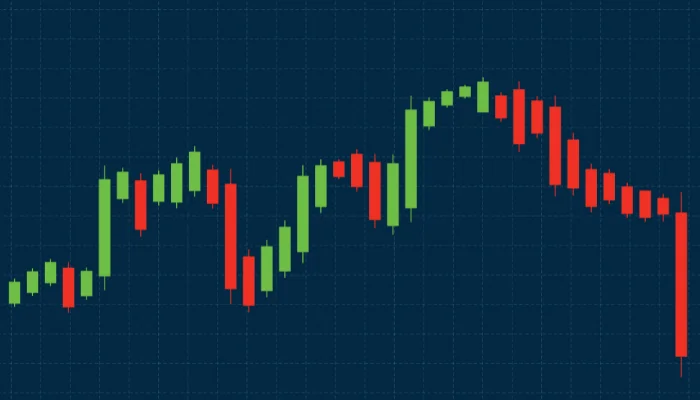
Reading a crypto chart for the first time can feel overwhelming. Dozens of red and green bars stack up across your screen, and it’s not immediately clear what any of it means. But hidden within that noise are repeating patterns candlestick formations that traders have used for centuries to anticipate price movements.
Candlestick charts originated in 18th-century Japan, developed by rice trader Munehisa Homma to track market sentiment. Today, crypto platforms like Filsx and Fillyx surface these same patterns in real time, giving traders a powerful edge in fast-moving markets.
This guide breaks down five of the most important candlestick patterns for crypto trading. Whether you’re analyzing Bitcoin, Ethereum, or an emerging altcoin, understanding these formations can sharpen your entries, exits, and overall decision-making.
What Are Candlestick Patterns and Why Do They Matter for Crypto?
Each candlestick represents a specific time period one minute, one hour, one day and captures four data points: the open, close, high, and low price. The body of the candle shows the range between open and close, while the wicks (or shadows) show the extremes.
Patterns form when two or more candlesticks arrange in a recognizable way. These arrangements reflect shifts in buyer and seller sentiment and in crypto, where markets run 24/7 and volatility is high, spotting these shifts early can make a meaningful difference to your results.
Platforms like Filsx and Fillyx make it easier to identify these patterns with built-in charting tools and real-time alerts. But knowing what to look for is half the battle.
Three White Soldiers: A Strong Bullish Reversal Signal
Three White Soldiers is a three-candle pattern that signals a strong shift from bearish to bullish momentum. It appears after a downtrend and consists of three consecutive long green (bullish) candles, each opening within the body of the previous candle and closing progressively higher.
The pattern tells a clear story: buyers are stepping in with conviction, session after session, pushing prices higher with little resistance. In crypto markets, where sentiment can flip quickly, Three White Soldiers is one of the more reliable indicators of a sustained upward move.
What to watch for: Each candle should have a small or nonexistent upper wick. Large wicks signal hesitation and weaken the pattern’s reliability.
Doji: When the Market Can’t Make Up Its Mind
A Doji forms when the open and close prices are nearly identical, resulting in a very small body with wicks extending in both directions. Visually, it looks like a cross or plus sign.
Doji candles represent indecision. Neither buyers nor sellers managed to gain control during that period and in crypto, that kind of standoff often precedes a significant move in either direction.
Doji patterns are most meaningful in context. A Doji appearing after a long uptrend can signal exhaustion and a potential reversal. The same pattern mid-trend carries much less weight. Traders using Filsx and Fillyx often use Doji signals in combination with volume data and support/resistance levels to improve accuracy.
Engulfing Patterns: Momentum Shifts in Two Candles
Engulfing patterns are two-candle formations that signal a shift in market control. There are two types:
- Bullish Engulfing: A small red candle is followed by a larger green candle that completely engulfs the previous candle’s body. This indicates buyers have overtaken sellers and a price increase may follow.
- Bearish Engulfing: The opposite—a small green candle followed by a larger red candle that engulfs it, suggesting sellers have taken control.
The key word is “engulfs.” The second candle must fully cover the body of the first—not just partially overlap it. When this condition is met at a key support or resistance level, the signal carries significantly more weight.
Engulfing patterns are among the most widely watched formations on platforms like Fillyx, largely because they’re easy to spot and tend to appear at meaningful turning points in the market.
Hammer: A Reversal Signal Built on Rejection
The Hammer is a single-candle pattern with a small body at the top and a long lower wick—typically at least twice the length of the body. It appears after a downtrend and signals that sellers pushed prices sharply lower during the session, but buyers stepped in and drove the price back up before the close.
That long lower wick is the defining feature. It represents a rejection of lower prices, which is exactly why the Hammer is considered a bullish reversal signal. The longer the wick relative to the body, the stronger the rejection and the more meaningful the pattern.
Bullish Hammer vs. Hanging Man: The same candlestick shape appearing after an uptrend is called a Hanging Man and carries a bearish implication. Context matters enormously with this pattern.
For crypto traders monitoring shorter timeframes on Filsx, the Hammer is a particularly useful pattern because crypto assets frequently test key support levels before bouncing sharply.
Perfect Dragonfly Doji: Precision Reversal at Its Best
The Perfect Dragonfly Doji is a specialized candlestick where the open, high, and close prices are all at (or very near) the same level, with a long lower wick and virtually no upper wick. The result is a T-shaped candle.
This pattern is a more precise version of the Hammer. The “perfect” qualifier means there’s almost no body at all the open and close are essentially identical. Sellers drove the price down aggressively, but buyers clawed it back entirely to the opening level, leaving no trace of a body.
When the Perfect Dragonfly Doji appears at a well-established support zone, it’s one of the cleaner reversal signals available to crypto traders. Its specificity is also its limitation it doesn’t appear often. But when it does, traders on platforms like Fillyx and Filsx tend to pay close attention.
How to Use Candlestick Patterns Effectively in Crypto Trading
Candlestick patterns are tools not guarantees. A few principles that improve their reliability:
- Confirm with volume. A bullish reversal pattern accompanied by high trading volume is far more credible than one that forms on thin volume.
- Check the timeframe. Patterns on daily or four-hour charts carry more weight than those on one-minute charts.
- Use confluence. Patterns that form at key support, resistance, or Fibonacci levels are stronger signals than those appearing mid-range.
- Avoid overtrading patterns. Not every Doji or Hammer is a trade. Context, trend direction, and confirmation all matter.
Filsx and Fillyx both offer tools that help traders filter for high-quality pattern signals, reducing the noise that comes with scanning charts manually.
Start Reading the Market Like a Trader
Candlestick patterns won’t predict every move the market makes nothing will. But they do offer a structured, time-tested way to interpret price behavior and make more informed trading decisions.
The five patterns covered here Three White Soldiers, Doji, Engulfing Patterns, Hammer, and the Perfect Dragonfly Doji form a solid foundation for any crypto trader looking to improve their chart-reading skills. Practice spotting them on historical charts first, then move to live markets with a clear plan.
Platforms like Filsx and Fillyx make it easier to apply this knowledge in real time. Explore their charting features and start identifying these patterns in the assets you’re already watching.
FAQs
What is the most reliable candlestick pattern for crypto trading?
No single pattern is universally reliable, but Engulfing patterns and Three White Soldiers are widely regarded as strong signals when they appear at key support or resistance levels with high volume. The Perfect Dragonfly Doji is rare but precise.
Can candlestick patterns be used for short-term crypto trading?
Yes. Candlestick patterns work across all timeframes, but shorter timeframes (such as one-minute or five-minute charts) generate more noise and false signals. Patterns on four-hour or daily charts tend to be more reliable for decision-making.
How do I know if a candlestick pattern is valid?
A pattern is stronger when it appears at a meaningful price level (such as support or resistance), is confirmed by above-average trading volume, and aligns with the broader market trend. Isolation alone makes a pattern weaker.
Do Filsx and Fillyx support candlestick pattern analysis?
Yes. Both Filsx and Fillyx offer charting tools and real-time features that help traders identify and act on candlestick patterns across multiple crypto assets and timeframes.
What’s the difference between a Hammer and a Perfect Dragonfly Doji?
Both share a long lower wick and signal bullish reversals, but a Hammer has a small visible body (the open and close differ slightly), while a Perfect Dragonfly Doji has virtually no body—the open, high, and close are all at the same level.